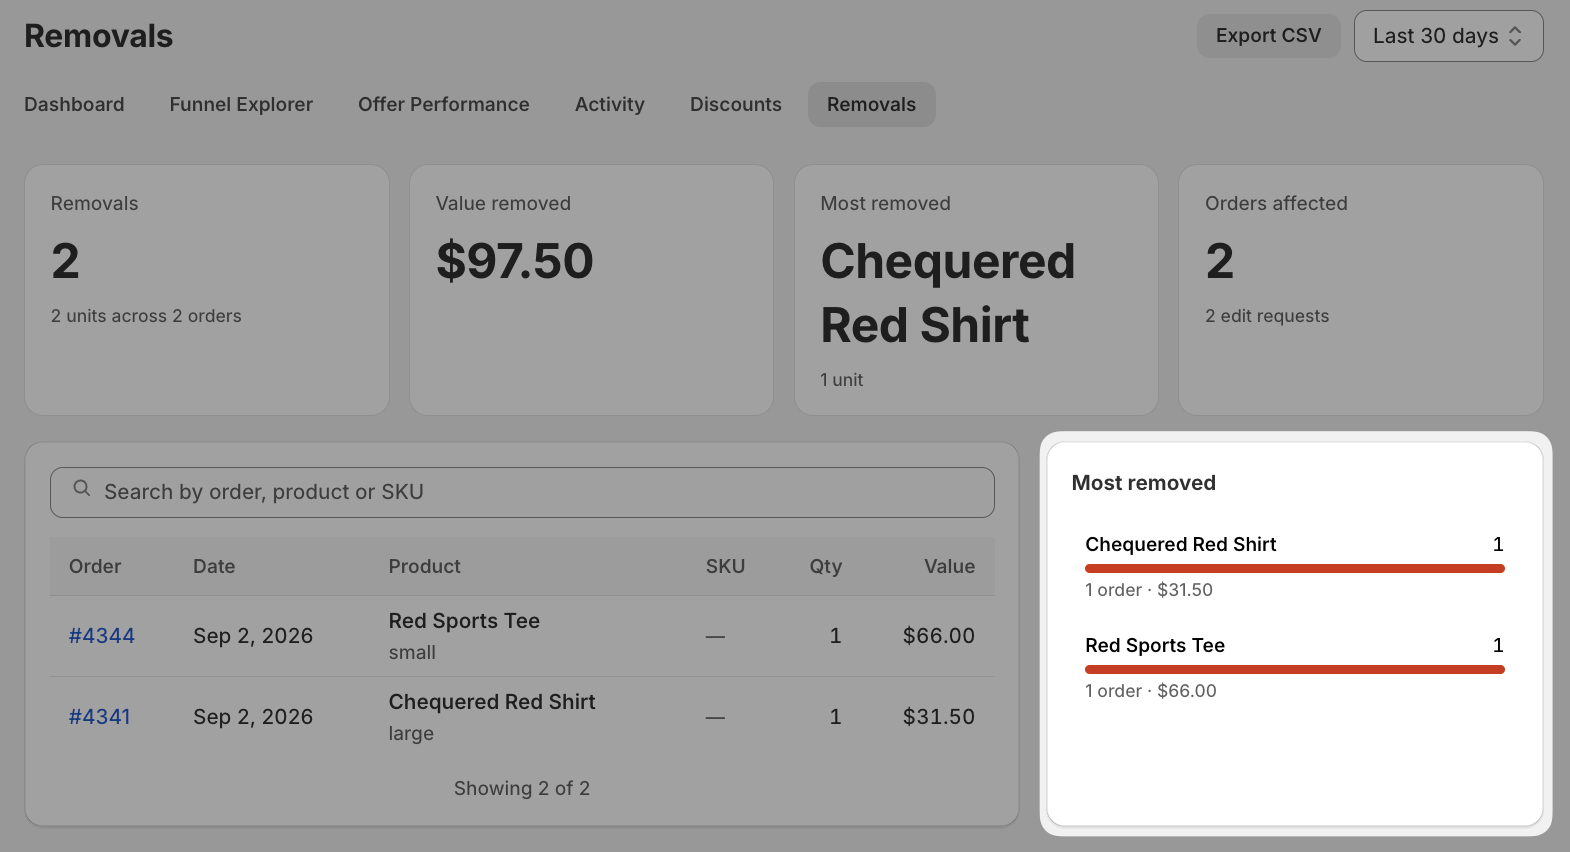

Understanding removals analytics in Customer Portal
Updated last month
Your Cleverific dashboard already reports how many items customers remove from their orders in Customer Portal. The Removals section in your Analytics shows which items were removed, per order, along with a ranking of your most commonly removed products. The report is retroactive, so the removal history already on your account appears as soon as the page is available to you.
View removals analytics
From your Shopify admin, go to Apps > Cleverific > Analytics.
Navigate to the Removals tab. You can also get here by clicking the Removed line item row on your App Dashboard.

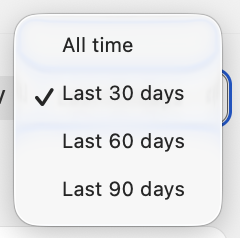
Use the period selector to choose your reporting window.
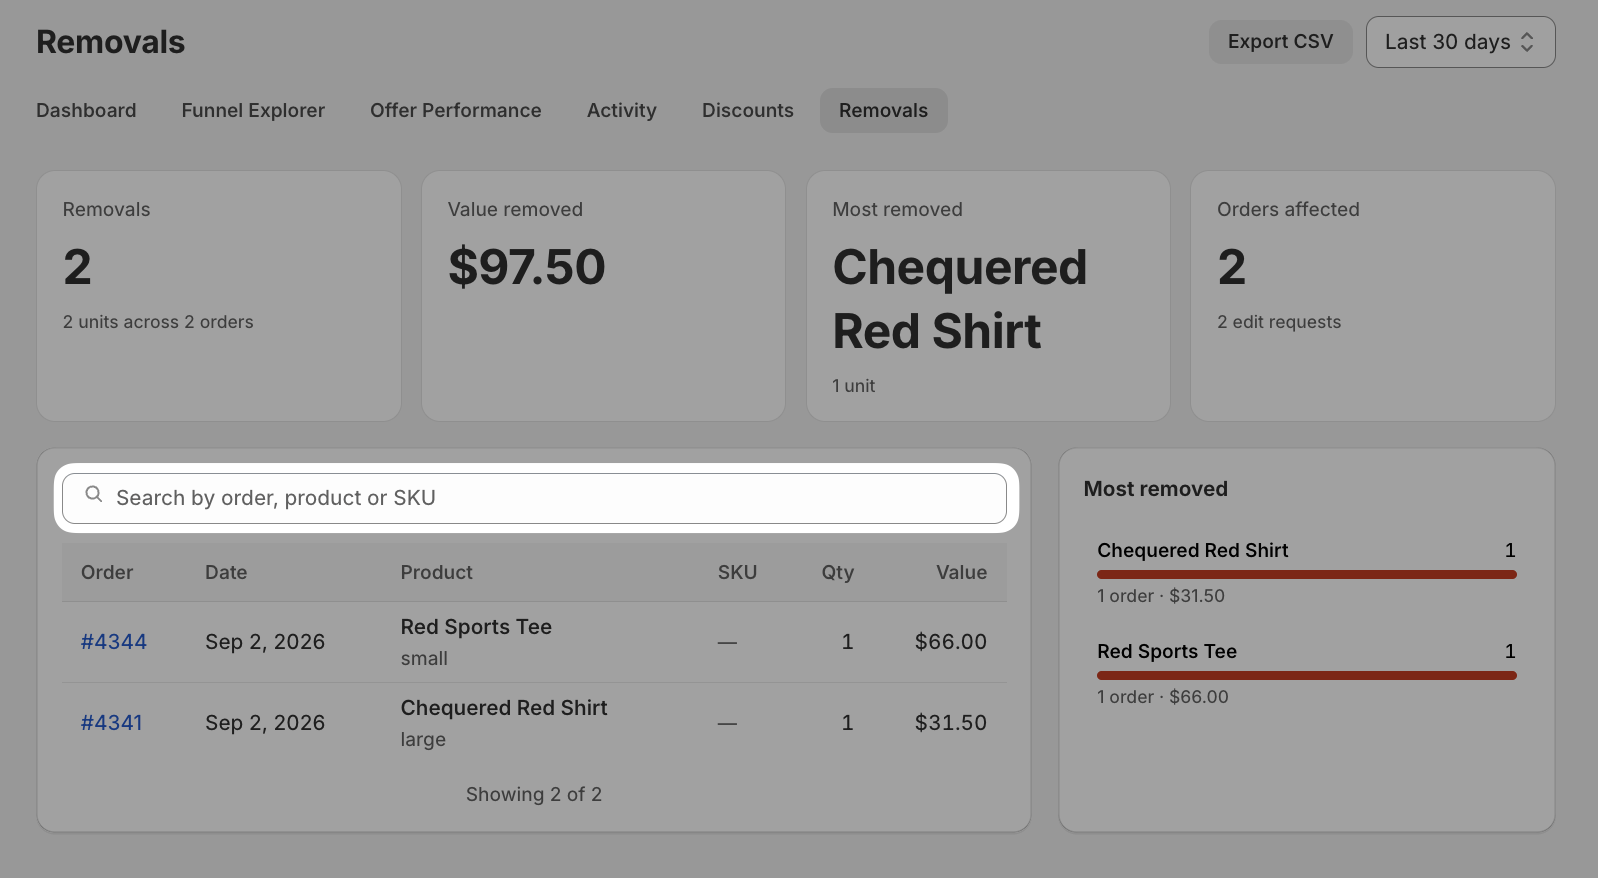
Use the search field to find a specific product or SKU.
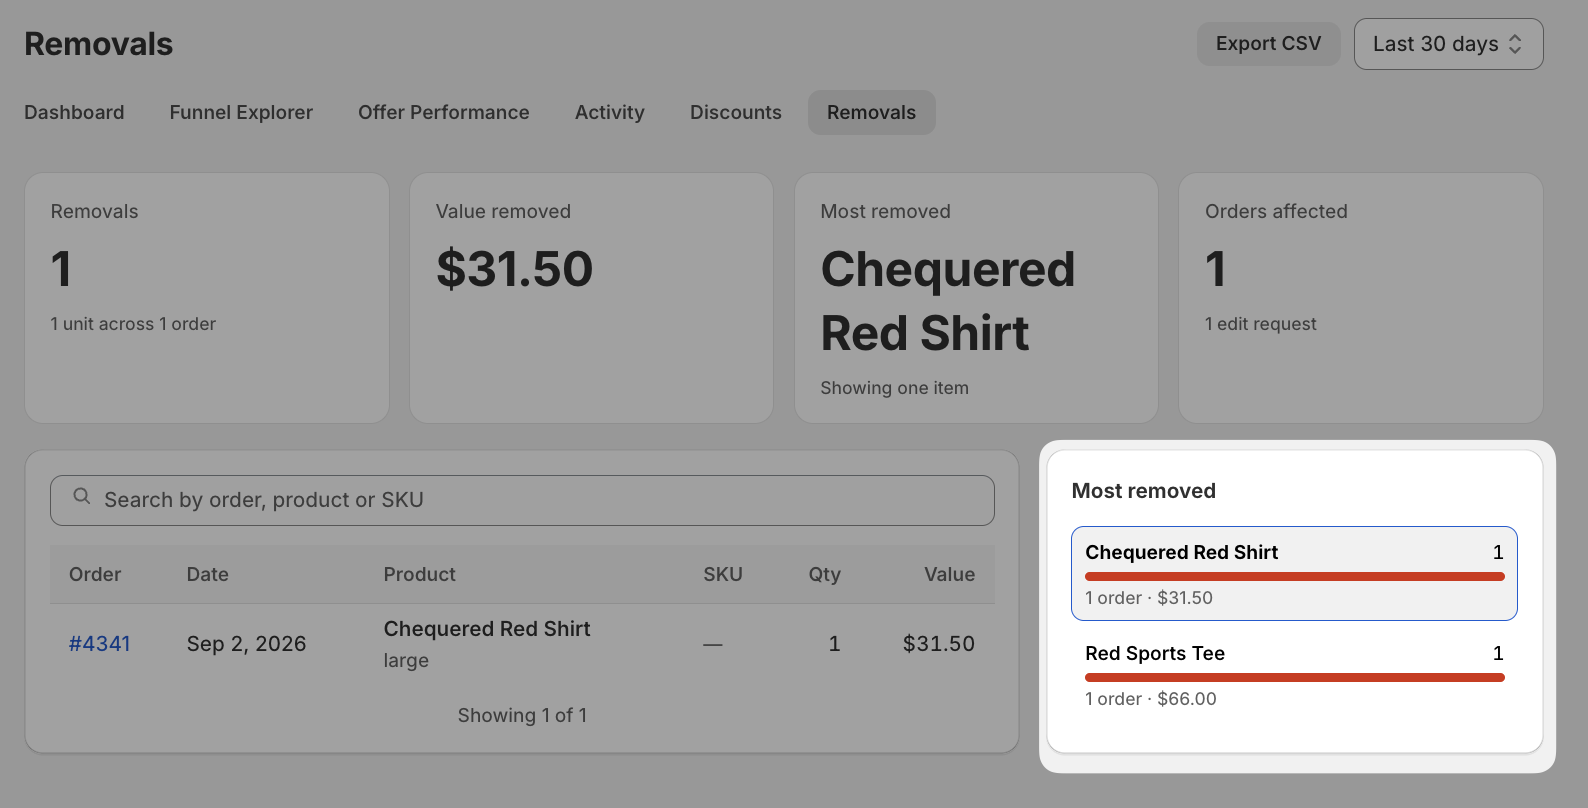
Click a product in the Most removed ranking to filter the table to that item. Click it again to clear the filter.
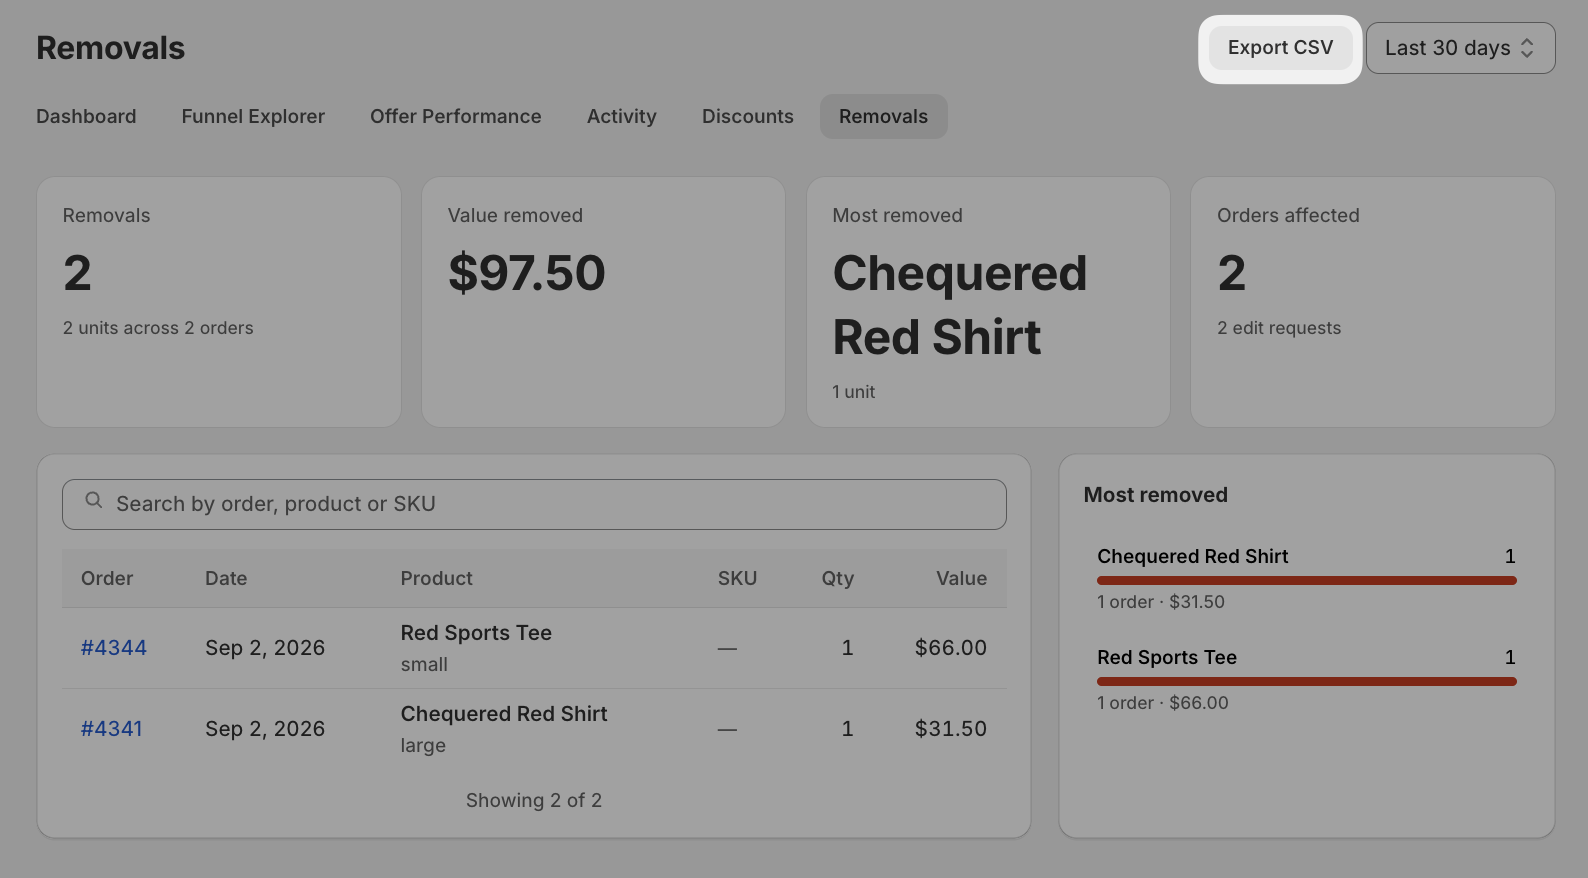
Click Export CSV to download the product, SKU, quantity, price, currency, and product and variant IDs for the full period. This ignores any search filter you've applied on screen.
What the report shows
Each row lists the product, SKU, quantity, value, and removal date for a removed line item, with a link that opens the order in Shopify Admin.
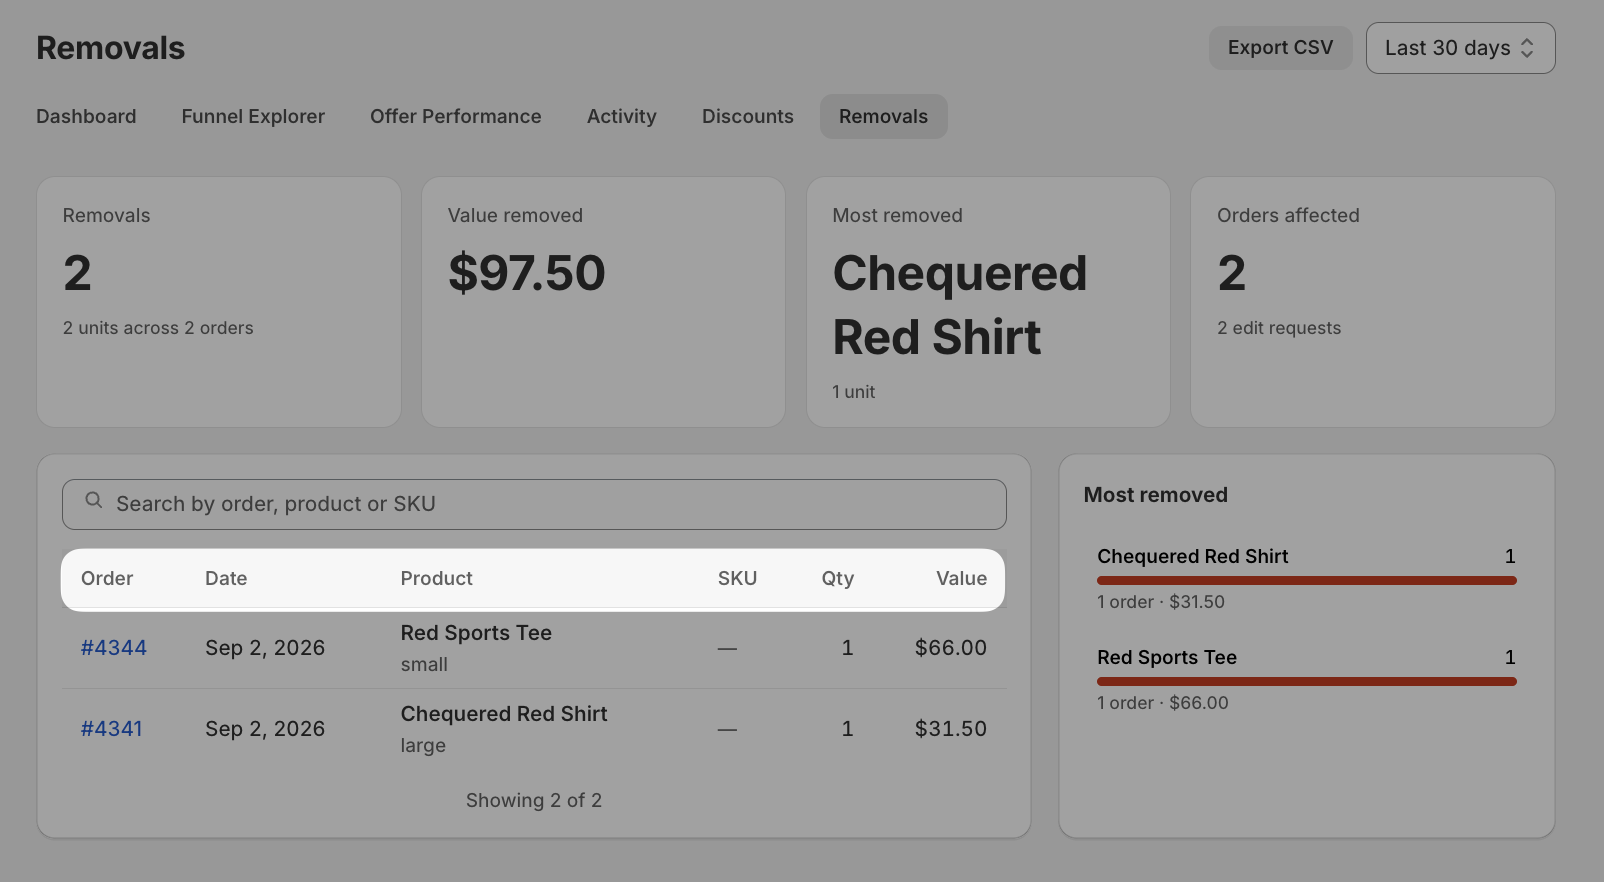
Items with no SKU set show a dash instead of a blank cell.
The Most removed panel ranks your products by how often they've been removed.